
Dashboard camera statistics: the market is still big, but it is no longer at its peak
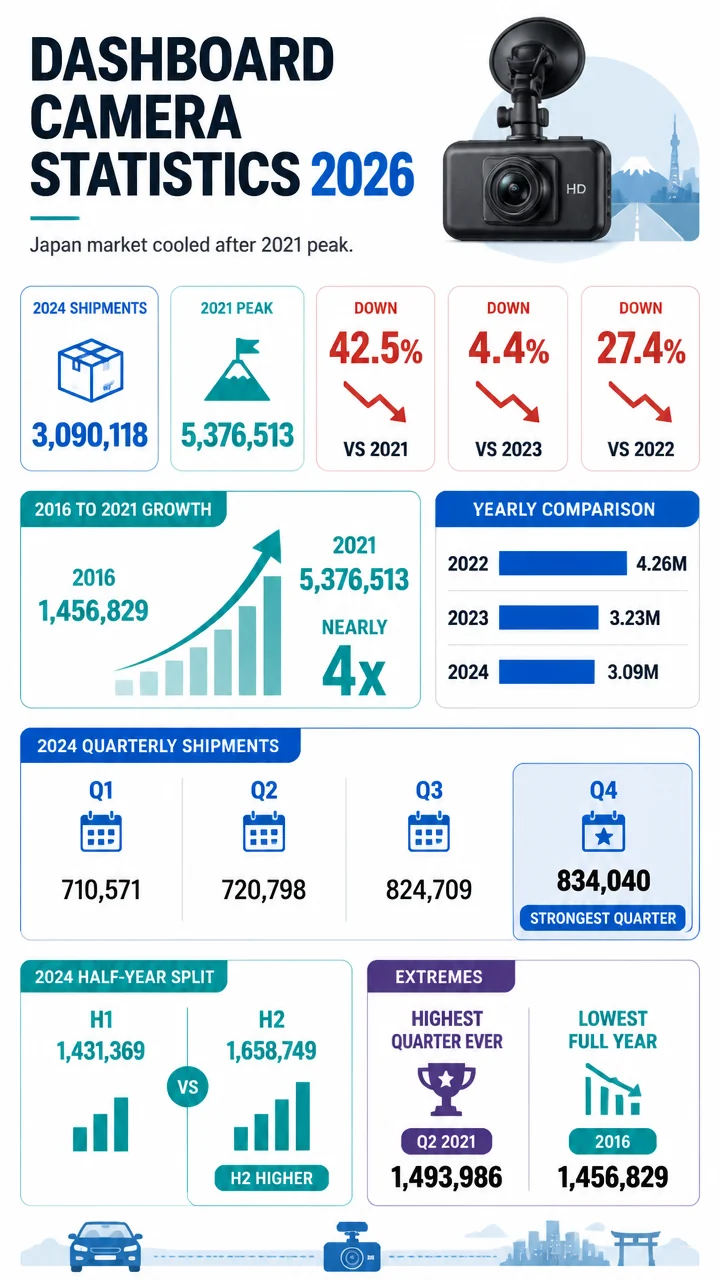
Japan shipped 3,090,118 dashboard cameras in 2024, according to JEITA, a sizable market by any standard.
But the more striking stat is that 2024 volume sits far below the category’s recent high, showing how sharply the market has cooled since 2021.
The dataset tells a clear story: rapid expansion from 2016 to 2021, then a multiyear decline, followed by signs of stabilization in late 2024 as second-half shipments edged above the previous year.
- 2024 full-year shipments: 3,090,118 units
- 2021 peak: 5,376,513 units
- Drop from 2021 to 2024: about 42.5%
- Lowest full year in dataset: 1,456,829 units in 2016
- Highest quarter in dataset: 1,493,986 units in Q2 2021
- 2024 second half: 1,658,749 units
- 2024 first half: 1,431,369 units
Table of contents
- Key dashboard camera statistics
- Dashboard camera shipment trends by year
- Dashboard camera year-over-year statistics
- Dashboard camera quarterly statistics
- Dashboard camera first-half vs second-half statistics
- Dashboard camera rankings and extremes
- Dashboard camera market benchmarks
Key dashboard camera statistics
- 3.09 million dashboard cameras were shipped in Japan in 2024.
- 2024 shipments fell 4.4% from 3,233,034 units in 2023.
- 2021 remains the peak year at 5,376,513 units.
- 2024 shipments were 27.4% below 2022 and 42.5% below 2021.
- Q4 2024 was the strongest quarter of the year at 834,040 units.
- Q2 2021 was the highest quarter in the full dataset at 1,493,986 units.
- 2016 to 2021 shipments nearly quadrupled, climbing from 1,456,829 to 5,376,513 units.
- 2024 second-half shipments slightly beat 2023 second-half shipments, despite the full-year decline.
Big number: 5,376,513.
That is the number of dashboard cameras shipped in Japan in 2021, the highest annual total in the supplied data.
From 1.46 million units in 2016 to 5.38 million in 2021, Japan’s dashboard camera market expanded by roughly 269% before entering a three-year correction.
Dashboard camera shipment trends by year
The long-range trend is the most important angle in this dataset.
Annual shipments rose sharply from 2016 through 2021, then retreated in 2022, 2023, and 2024.
| Year | Full-Year Shipments | Year-over-Year Change |
|---|---|---|
| 2016 | 1,456,829 | — |
| 2017 | 2,665,309 | +82.9% |
| 2018 | 3,671,669 | +37.8% |
| 2019 | 4,839,241 | +31.8% |
| 2020 | 4,599,663 | -5.0% |
| 2021 | 5,376,513 | +16.9% |
| 2022 | 4,257,906 | -20.8% |
| 2023 | 3,233,034 | -24.1% |
| 2024 | 3,090,118 | -4.4% |
Why it matters: the market did not simply grow in a straight line.
It went through a strong adoption phase, hit a peak, and then declined for three consecutive years.
The strongest expansion happened early in the dataset.
Annual volume jumped from 1,456,829 in 2016 to 2,665,309 in 2017, an increase of about 82.9%.
That is the fastest annual growth rate shown here.
Growth remained strong through 2018 and 2019.
Shipments climbed to 3,671,669 in 2018 and 4,839,241 in 2019, meaning the market added more than 3.38 million annual units over just three years.
The first interruption came in 2020, when annual shipments dipped to 4,599,663, down about 5.0% from 2019.
But that pullback was temporary.
In 2021, the market rebounded to its all-time high of 5,376,513.
Since that peak, the trend has moved in the opposite direction:
- 2022: 4,257,906 units
- 2023: 3,233,034 units
- 2024: 3,090,118 units
That means Japan’s dashboard camera market lost about 2.29 million annual units between 2021 and 2024.
Dashboard camera year-over-year statistics
The year-over-year changes make the slowdown even clearer.
While 2024 was down only modestly from 2023, both years remain substantially below the category’s recent highs.
- 2024 vs 2023: -142,916 units, or about -4.4%
- 2023 vs 2022: -1,024,872 units, or about -24.1%
- 2022 vs 2021: -1,118,607 units, or about -20.8%
- 2021 vs 2020: +776,850 units, or about +16.9%
The sharpest annual decline in the dataset came in 2023, when shipments fell by more than 1.02 million units from the prior year.
At the same time, the latest data also hints that the pace of decline is easing.
The drop from 2023 to 2024 was far smaller than the drop from 2022 to 2023.
In percentage terms, the contraction improved from -24.1% to -4.4%.
2024 was still down year over year, but it was much closer to stabilization than collapse.
Another useful benchmark is the comparison with pre-peak years:
- 2024 vs 2019: down about 36.1%
- 2024 vs 2020: down about 32.8%
- 2024 vs 2018: down about 15.8%
- 2024 vs 2017: up about 15.9%
- 2024 vs 2016: up about 112.1%
Those comparisons show that 2024 is weak relative to the 2019–2021 stretch, but still much larger than the market was in the mid-2010s.
Dashboard camera quarterly statistics
Quarterly shipment data reveals seasonality, momentum changes, and the rise-and-fall cycle in more detail.
| Year | Q1 | Q2 | Q3 | Q4 |
|---|---|---|---|---|
| 2016 | 323,407 | 329,219 | 386,813 | 417,390 |
| 2017 | 418,189 | 430,063 | 857,991 | 959,066 |
| 2018 | 787,866 | 863,209 | 939,116 | 1,081,478 |
| 2019 | 1,082,242 | 1,315,146 | 1,316,720 | 1,125,133 |
| 2020 | 742,356 | 1,351,821 | 1,325,966 | 1,179,520 |
| 2021 | 1,433,516 | 1,493,986 | 1,180,025 | 1,268,986 |
| 2022 | 1,113,435 | 1,028,716 | 1,076,872 | 1,038,883 |
| 2023 | 731,920 | 844,858 | 891,522 | 764,734 |
| 2024 | 710,571 | 720,798 | 824,709 | 834,040 |
The highest quarter in the entire dataset was Q2 2021 at 1,493,986 units.
The lowest was Q1 2016 at 323,407 units.
That means the market’s strongest quarter was about 4.62 times larger than the weakest quarter in the series.
What stands out in the quarterly dashboard camera data
- Late-year strength was common in earlier years. From 2016 through 2018, Q4 was the strongest quarter every year.
- 2019 was almost perfectly balanced at the top. Q2 and Q3 were nearly identical, at 1,315,146 and 1,316,720 units.
- 2020 had an unusual rebound pattern. Q1 was only 742,356 units, but Q2 surged to 1,351,821.
- 2021 front-loaded demand. Q1 and Q2 were both above 1.43 million, then volume eased in Q3 and Q4.
- 2024 improved as the year progressed. Every quarter after Q1 was higher than the one before it.
For 2024 specifically, quarterly shipments moved from 710,571 in Q1 to 720,798 in Q2, then to 824,709 in Q3 and 834,040 in Q4.
That is a steady upward progression, even if the absolute levels remain below earlier highs.
2024’s quarter-by-quarter climb suggests some recovery in momentum during the year, especially compared with the choppier patterns seen in 2023 and the much larger but declining back half of 2021.
Dashboard camera first-half vs second-half statistics
Half-year totals are one of the easiest ways to spot intra-year demand shifts.
In several years, second-half shipments outpaced first-half shipments, but that pattern changed at key moments.
| Year | First Half | Second Half | Difference |
|---|---|---|---|
| 2016 | 652,626 | 804,203 | +151,577 |
| 2017 | 848,252 | 1,817,057 | +968,805 |
| 2018 | 1,651,075 | 2,020,594 | +369,519 |
| 2019 | 2,397,388 | 2,441,853 | +44,465 |
| 2020 | 2,094,177 | 2,505,486 | +411,309 |
| 2021 | 2,927,502 | 2,449,011 | -478,491 |
| 2022 | 2,142,151 | 2,115,755 | -26,396 |
| 2023 | 1,576,778 | 1,656,256 | +79,478 |
| 2024 | 1,431,369 | 1,658,749 | +227,380 |
2024 second-half shipments exceeded first-half shipments by 227,380 units.
That is one of the strongest late-year advantages in the recent post-peak period.
The most dramatic second-half skew came in 2017, when shipments jumped from 848,252 in the first half to 1,817,057 in the second half.
That gap of 968,805 units is the largest half-to-half swing in the dataset.
2021 was the big exception. It was the only year in the data with a clearly stronger first half at scale, as the market shipped 2,927,502 units in H1 versus 2,449,011 in H2.
That matters because it shows the 2021 peak was driven heavily by early-year demand.
In contrast, 2024’s shape looks more like a gradual recovery year, with momentum building into Q3 and Q4.
Even though 2024 trailed 2023 for the full year, its second half was slightly higher: 1,658,749 versus 1,656,256 units.
That is a tiny difference of 2,493 units, but it stands out because the full-year comparison was still negative.
It hints that late-2024 conditions were more resilient than the headline annual total suggests.
Dashboard camera rankings and extremes
Ranking the data highlights how concentrated the strongest years and quarters were.
Top full years by dashboard camera shipments
- 2021: 5,376,513
- 2019: 4,839,241
- 2020: 4,599,663
- 2022: 4,257,906
- 2018: 3,671,669
- 2023: 3,233,034
- 2024: 3,090,118
- 2017: 2,665,309
- 2016: 1,456,829
2024 ranks seventh out of the nine full years in the dataset.
It sits above only 2016 and 2017.
Top quarters by dashboard camera shipments
- Q2 2021: 1,493,986
- Q1 2021: 1,433,516
- Q2 2020: 1,351,821
- Q3 2020: 1,325,966
- Q3 2019: 1,316,720
- Q2 2019: 1,315,146
- Q4 2021: 1,268,986
- Q4 2020: 1,179,520
- Q3 2021: 1,180,025
- Q4 2019: 1,125,133
One surprising pattern: none of 2024’s quarters crack the top 20% of quarterly observations in this dataset.
That reinforces how far current shipment levels sit below the market’s peak era.
- Highest annual total: 5,376,513 in 2021
- Lowest annual total: 1,456,829 in 2016
- Highest half-year total: 2,927,502 in H1 2021
- Highest second half: 2,505,486 in H2 2020
- Highest Q4: 1,268,986 in Q4 2021
- Highest Q1: 1,433,516 in Q1 2021
Dashboard camera market benchmarks and notable comparisons
Several benchmark comparisons make the dataset more useful for publishers, marketers, and industry watchers looking for quotable stats.
2024 annual shipments were about 57.5% of the 2021 peak. In other words, the market gave back more than two-fifths of its peak volume in just three years.
2024 was still 84.2% of 2018 volume. So while the market looks weak against 2021, it is not back to its earliest-stage levels.
The market more than tripled from 2016 to 2019. Annual shipments rose from 1,456,829 to 4,839,241, a gain of roughly 232.2% in three years.
2019 and 2020 were remarkably close at scale. The difference between them was only 239,578 units, or about 5.0%.
2023 and 2024 were also relatively close. The gap was 142,916 units, much smaller than the drop seen from 2022 to 2023.
- The market’s boom phase happened from 2016 through 2021.
- The correction phase happened from 2022 through 2024.
- Late-2024 momentum improved, even though the annual headline remained down.
- The dataset suggests a market that is cooler than peak years but still materially larger than its early base.
For SEO and editorial framing, the most clickable numbers in this dataset are likely these:
- 3.09 million units shipped in 2024
- 42.5% decline from the 2021 peak
- 5.38 million units shipped at the 2021 high
- Q2 2021 peak quarter at 1.49 million units
- 2016 to 2021 growth of roughly 269%
Japan’s dashboard camera market did not disappear in 2024. It shipped more than 3 million units.
But compared with the 2021 high, the industry is operating at a very different level.
That is the central insight behind these dashboard camera statistics: the category remains substantial, yet the standout story is the gap between today’s shipment base and the extraordinary highs reached just a few years earlier.